Understanding the Market Overview and Optimals
This article will describe the ins-and-outs of the Market Overview page on this website. After reading this article, you should have a good understanding of the data that you are looking at on our homepage and how to navigate it.
The "Best" Trade?
The main purpose of the Market Overview page is to rank the "best" options by the trading day and the timeframe. "Best" options trades are put in quotes here because the definition of what is best is likely relative to you. How much time are you willing to hold a trade for? How much money do you have to invest? How quickly do you want your investment to pay out? What is your risk tolerance?
For you, the "best" options trade might be one that has a high probability of a small profit over a 2 year period. For someone whose rent is due in 5 days and they're short $5000, the best trade might be an ultra high-risk trade that can turn $100 into $5000 in a day.
At MarketApex.com, we define "best" to mean the options trade with the highest percent gain relative to all other possible trades confined to a given buy and sell window. In this way, we can have an apples-to-apples comparison. To illustrate an example, we first need to understand and label the buy and sell windows.
Types of Trades and Buy/Sell Window
| Label / Types of trade | Buy Window | Sell Window |
|---|---|---|
| Daily | Current trading day | Current trading day |
| Overnight | Previous trading day | Current trading day |
| Weekly | 2-5 trading days prior to the current trading day | Current trading day |
| Monthly | 6-20 trading days prior to the current trading day | Current trading day |
| Quarterly | 21-65 trading days prior to the current trading day | Current trading day |
| Semi-annually | 66-130 trading days prior to the current trading day | Current trading day |
| Yearly | 131-261 trading days prior to the current trading day | Current trading day |
The table above describes the types of trade, their label, and their buy/sell windows. A daily trade (or day trade) is defined as a trade where the option is bought and sold and on the same trading day. An overnight trade is defined as a trade where the option is bought on the previous trading day and sold on the current trading day, and so on…
By confining trades to a given buy and sell window, we can start to organize the data in a way that is conducive to answering questions about the stocks, markets, and options performance for those given time windows. Comparing a day-trade to a yearly trade doesn't really make sense and is more of an apples-to-oranges comparison because the risk tolerance and the mindset of the person making the trade is wildly different.
An Example
With this info, we can define the "best" day-trade as the day-trade trade that has the highest percent gain across all other day-trades in the market for that current day. Let's go through an example.
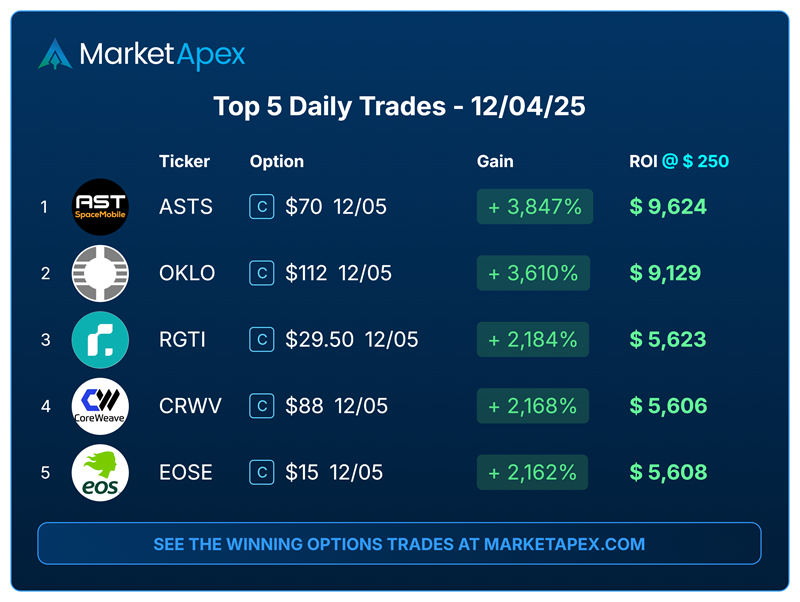
Above is an image of the top 5 best day trades on Dec 4th, 2025. At the top of the list is an ASTS $70 call option, with a 3,848% gain. What that basically means is that throughout all other possible day-trades that you could have done on that day, the one which would have made you the most money was the ASTS $70 call option. The ROI @$250 column tells you that if you had invested $250 into that trade, you would have made $9,624 dollars.
By clicking into the option itself, the options-info page would show you more details about the trade:
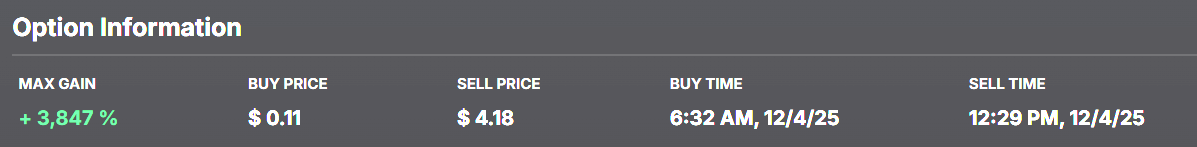
This tells you that you would have had to have bought the option at 6:32 AM (PST timezone) and sold at 12:29 PM. You would have bought the option at $0.11 (or $11 per option) and sold at $4.18 (or $418) for a total gain of 3,847%.
OKLO $112 calls would have been the next best options trade, at a 3,610% gain.
We can then extend this same classification to all other types of trades like overnight, weekly, and monthly trades. And that's esentially what the Market Overview page shows! You're looking at the best possible options trades across those time periods for the current trading day. We will sometimes refer to these as optimals, since optimal and best are synonymous in this case.
Market Overview Update Frequency
Regular market hours for stocks and options are between 9:30 AM EST and 4:00 PM EST. The Market Overview page will refresh all optimals once per minute, which is not quite real-time but very close.
During regular market hours stocks can swing wildly as news breaks or sentiment for a stock changes. The Market Overview is updated accordingly, so the top 5 day trades at 10:00 AM might be completely different from the top 5 day trades at 12:00 PM. This is especially true for Fridays, since options typically expire on Friday are extremely sensitive to price changes in the stock.
You can use the “Trading Day” filter in the market overview to go into the past and look at previous trading days, but keep in mind that you're looking at the data of the optimals at the time of close of the market.
How accurate is the Market Overview?
We try our best to have the data be as accurate as possible, but we make no guarantees and trades may still show up that aren't realistic or possible in the actual market.
During regular market hours, we don't have access to ANY real-time options quote data. We do not display that data to our users nor can we use that data internally for our own calculations, since OPRA licensing fees to use and display that data are astronomical (typically a base price of ~6K per month + ~$2 per month per unique user).
Our data provider provides us with “Fair Market Value” data, which are algorithmically derived, synthetic options data prices.
Just as an example, options that are significantly out-of-the-money often have a large bid-ask spread. The ask price might be 0.01 and the bid price might be 5.00. We don't have access to that quote data, and our data provider will provide us with a number like 2.50 (or more often 5.00). We use stock price data in conjunction with implied volatility feeds to calculate real-time BSM values of options. In conjunction with Fair Market Value data, we try to estimate the true value of an option. We also use advanced algorithms and filtering techniques to filter out as much noise and invalid price data as possible.
The end result is shown on our Market Overview page, which is not perfect but provides impressivly accurate estimates of the optimal trades.
How can I use this information??
That is for you to decide. Past performance is not any indication of future results, and any data displayed on MarketApex.com is not financial advice nor is it a recommendation to buy a stock or an option. We strongly advise that you consult your personal broker, financial advisor, or other qualified professional before making any investment decisions. You must read and agree on our Disclaimer and Terms of Use before using this site.
The spirit of this website is to provide historical research, educational insights, and data visualization.
Retail users don't have access to Bloomberg terminals, are typically confined to their watchlist,news articles, and lack a broad view on the market as it changes. Our goal is to bring data to our users free of charge, to allow them to go beyond their watchlist, but whether or not that data is useful is for them to decide.